Network Detection & Response
VMware vDefend Advanced Threat Prevention
My Role
Lead Product Designer
User Research
Team
1 Product Manager
2 Frontend Engineers
2 Backend Engineers
Tools
Figma
Timeline
Mar 2022 – Design Started
Apr 2023 – Design Handoff
Now – In Implementation
Description
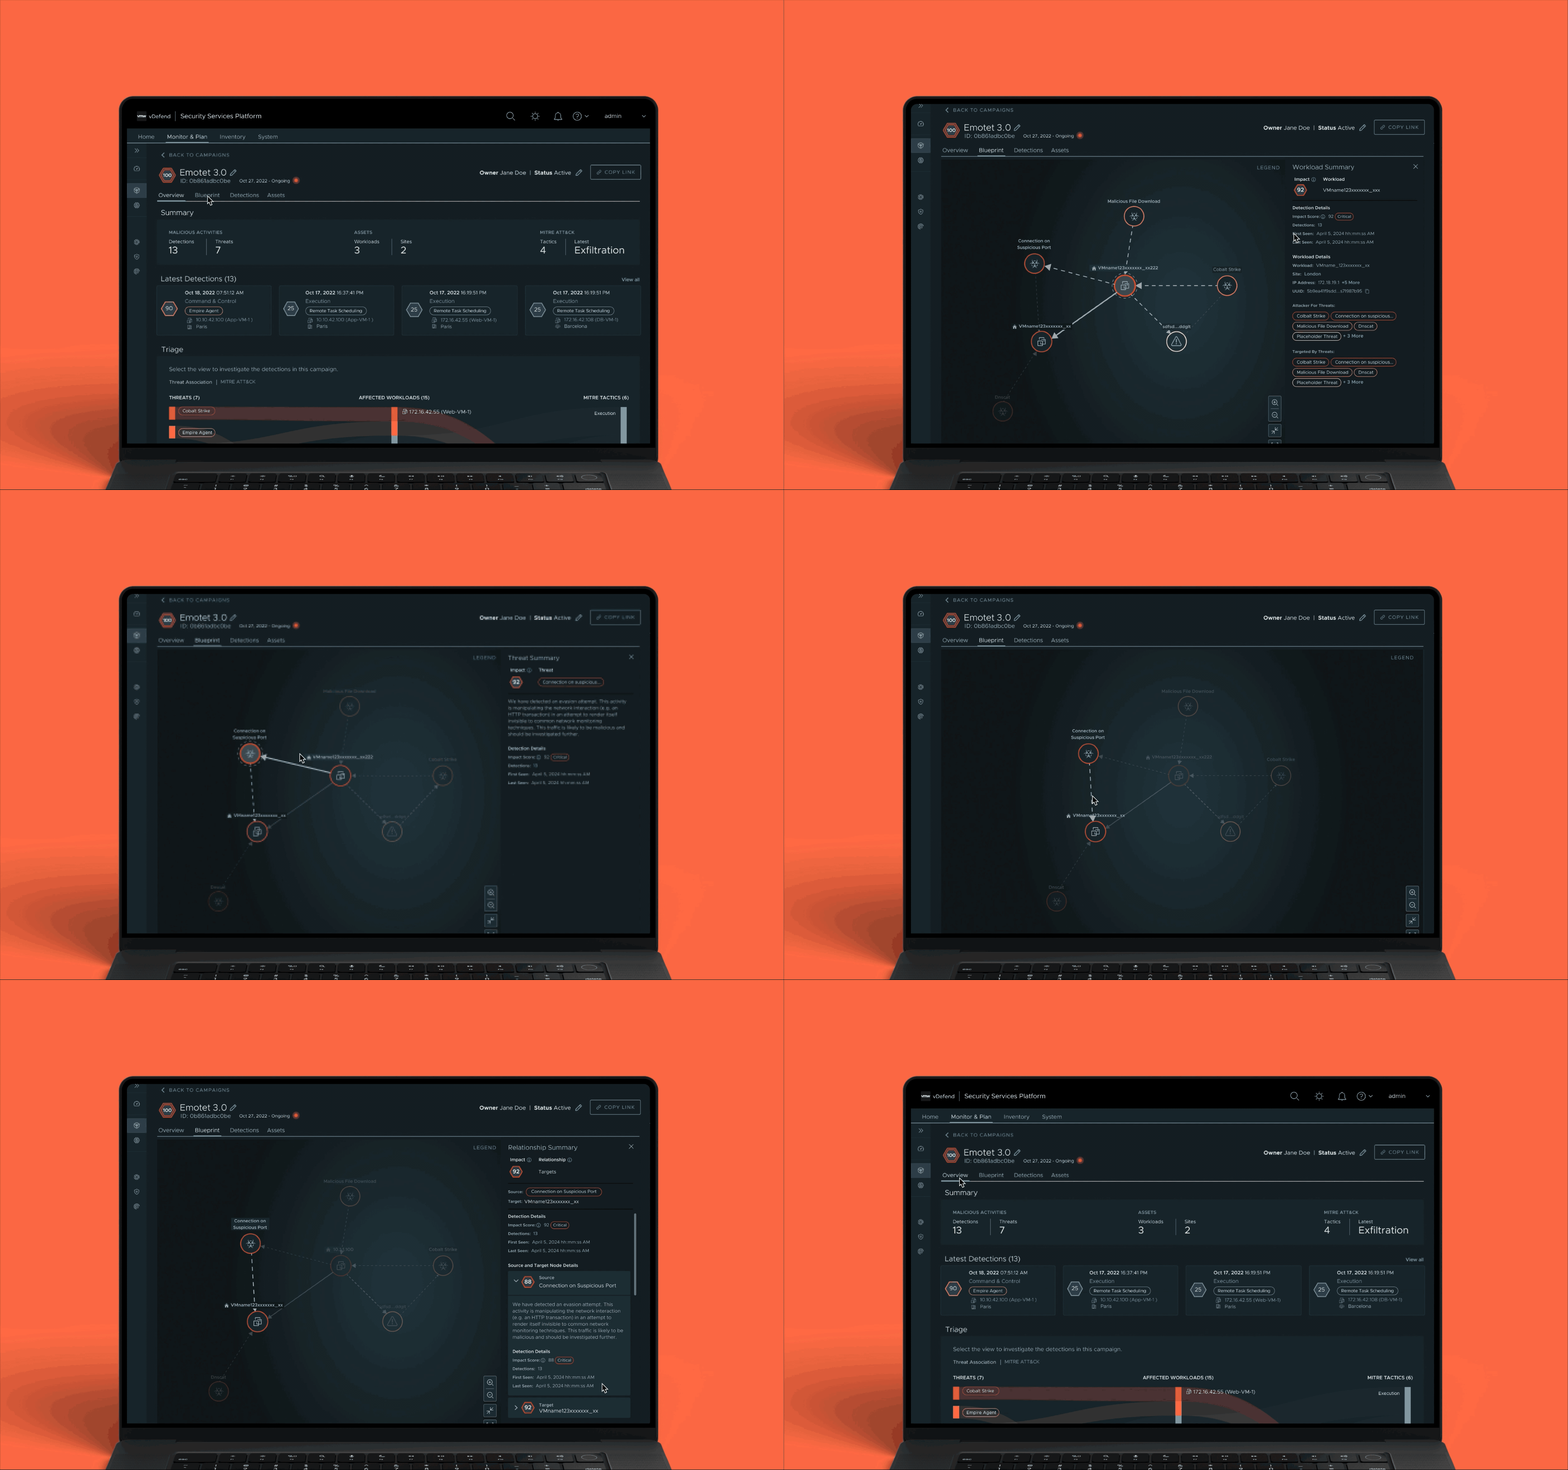
Designed a visual analytics experience to help security analysts triage complex cyberattack campaigns through an interactive visualization view.
Context
Network Detection and Response (NDR) products allow visibility of the security postures of a system; however, as cyberattacks occur so often and quickly, the volumes of raw data can easily overwhelm users. Making it difficult for security analysts to understand attack campaigns at scale.
To solve this, I led the design of the Campaign Dashboard and Campaign Blueprint for VMware’s Advanced Network Security platform.
The Campaign Dashboard introduced a Sankey diagram visualization to connect threats, workloads, and MITRE attack stages, giving users a powerful yet intuitive way to understand correlation, prioritize response, and navigate deep into threat details.
Moreover, the Campaign Blueprint view provides a visual map that tells the whole story of an attack, from the point of entry to the latest status.
Working across teams with backend engineers and PMs, I shaped a visualization system that transforms fragmented detection data into a clear narrative for investigation and response.
Impact
Created a scalable visualization structure that enables analysts to triage complex campaigns.
Improved threat triage efficiency by allowing users to quickly identify key threats, visualize correlations between threats, and act based on attack stage progression.
The new visualization experience became a core feature within VMware’s Advanced Security suite and was showcased at VMware’s 2023 and 2024 Annual Conferences as an innovation in cybersecurity UX.


